
The indicator
RIVERSTONE Daily Swing
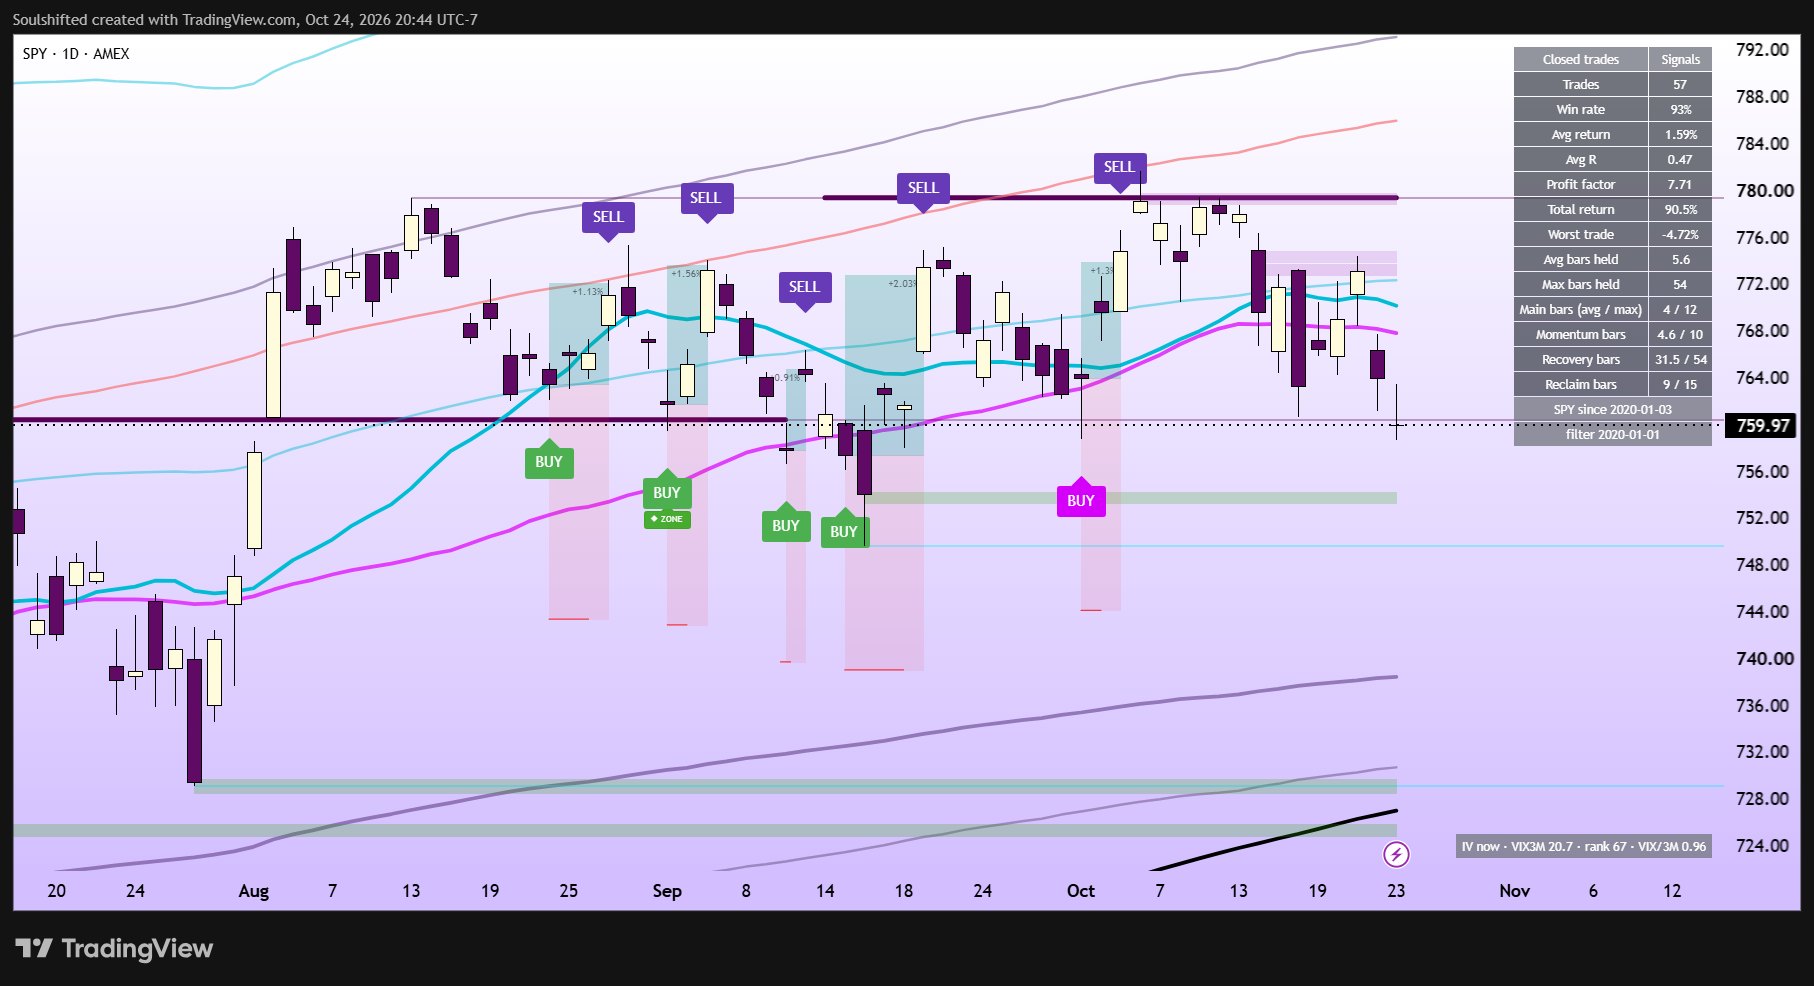
RS-Daily is a daily-chart indicator that looks for oversold dips in an established uptrend, and marks the first peak after a signal as a possible exit zone.
What it does
Trend filter
A moving-average filter keeps signals to charts that are already trending up.
Dip signal
A stochastic oversold reading inside that uptrend marks a signal. Historically, dips like these have tended to be buyable areas.
First-peak exit
By default RS-Daily marks the first peak after a signal, then waits for a fresh signal before flagging another.
Built for the daily
It's designed for the 1D timeframe and defaults to it.
How to add it
- Open the RS-Daily page on TradingView.
- Click Add to favorites.
- On any chart, open Indicators, go to Favorites, and pick RS-Daily.
- Set the chart to the daily timeframe.
The script is protected, so the code stays private, but the indicator is free for anyone to use.